
 5秒后页面跳转

| 型号 | 品牌 | 替代类型 | 描述 | 数据表 |
| ADSP-21363KBC-1AA | ADI |
完全替代  |
SHARC Processor |

|
| 型号 | 品牌 | 获取价格 | 描述 | 数据表 |
| ADSP-21363KSQZ-1AA | ADI |
获取价格 |
IC 16-BIT, 55.55 MHz, OTHER DSP, PQFP144, LEAD FREE, MS-026BFB-HD, LQFP-144, Digital Signa |
|
| ADSP-21363KSQZ-1AX | ADI |
获取价格 |
IC 16-BIT, 55.55 MHz, OTHER DSP, PQFP144, LEAD FREE, MS-026BFB-HD, LQFP-144, Digital Signa |
|
| ADSP-21363KSWZ-1AA | ADI |
获取价格 |
SHARC Processors |
|
| ADSP-21363SBBC-ENG | ADI |
获取价格 |
SHARC Processor |
|
| ADSP-21363SBBCZENG | ADI |
获取价格 |
SHARC Processor |
|
| ADSP-21363SBSQ-ENG | ADI |
获取价格 |
SHARC Processor |
|
| ADSP-21363SBSQZENG | ADI |
获取价格 |
SHARC Processor |
|
| ADSP-21363SCSQ-ENG | ADI |
获取价格 |
SHARC Processor |
|
| ADSP-21363SCSQZENG | ADI |
获取价格 |
SHARC Processor |
|
| ADSP-21363SKBC-ENG | ADI |
获取价格 |
SHARC Processor |
|
 摩尔斯微电子在美国约书亚树国家公园测试 Wi-Fi HaLow

 贸泽上架Tallysman TW5386智能GNSS天线
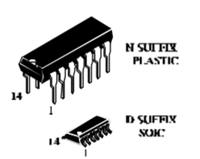 SL74HC10N:高性能三输入与非门解析
 AIC1781A 电池充电控制器深度解析
工作时间:9:00-21:00
CEO邮箱:ceo@jiepei.com
投诉邮箱:tousu@jiepei.com


 浙公网安备 33010502006866号 浙ICP备10014259号-119
营业执照ICP证
浙公网安备 33010502006866号 浙ICP备10014259号-119
营业执照ICP证


