
 5秒后页面跳转

| 生命周期: | Active | 包装说明: | , |
| Reach Compliance Code: | compliant | 风险等级: | 5.65 |
| Base Number Matches: | 1 |
| 型号 | 品牌 | 描述 | 获取价格 | 数据表 |
| MCP618-I/SN | MICROCHIP | 2.3V to 5.5V Micropower Bi-CMOS Op Amps |
获取价格 |

|
| MCP618-I/ST | MICROCHIP | 2.3V to 5.5V Micropower Bi-CMOS Op Amps |
获取价格 |
|
| MCP618T | MICROCHIP | 2.3V to 5.5V Micropower Bi-CMOS Op Amps |
获取价格 |
|
| MCP618T-I/MS | MICROCHIP | 2.3V to 5.5V Micropower Bi-CMOS Op Amps |
获取价格 |
|
| MCP618T-I/P | MICROCHIP | 2.3V to 5.5V Micropower Bi-CMOS Op Amps |
获取价格 |
|
| MCP618T-I/SL | MICROCHIP | 2.3V to 5.5V Micropower Bi-CMOS Op Amps |
获取价格 |
|
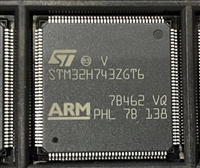 STM32H743技术深度剖析与应用案例探索

 LM321中文资料解析:引脚功能介绍、技术特点、技术特性分析
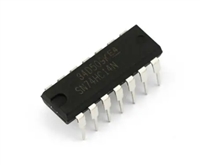 74HC14芯片资料介绍:性能特性分析、引脚介绍
 LM1875芯片手册:功放参数分析、引脚说明、电路设计要点
工作时间:9:00-21:00
CEO邮箱:ceo@jiepei.com
投诉邮箱:tousu@jiepei.com


 浙公网安备 33010502006866号 浙ICP备10014259号-119
营业执照ICP证
浙公网安备 33010502006866号 浙ICP备10014259号-119
营业执照ICP证


