GPIB Analyzers for PCI and PCI Express
NI PCI-GPIB+, NI PCIe-GPIB+,
NI PCIe-GPIB+ Low-Profile (LP)
◾◾
Analyzer Hardware
Capture event markers for easy
analysis and benchmarking
Selective captured event printing
Software can run concurrently
with GPIB applications
◾◾
Monitor and control all GPIB lines
◾◾
◾◾
◾◾
Capture GPIB events including
event timestamping
Large FIFO for high-speed captures
◾◾
◾◾
Hardware triggering
Variable handshake rate
Capture GPIB handshake
line transitions
Controller
◾◾
◾◾
IEEE 488.2 and HS488 compatible
◾◾
◾◾
Jumperless, software configurable
◾◾
Plug-and-play compatible
Analyzer Software
Operating Systems
◾◾
Easy-to-use graphical application
◾◾
Windows Vista (32- and 64-bit)/XP/2000
◾◾
Selective GPIB event capture
Driver Software (included)
◾◾
Several windows for capture buffer
◾◾
NI-488.2
and capture display
Several data display formats
◾◾
GPIB analyzer
◾◾
◾◾
Captured data searchable
for specified GPIB pattern
the Capture button in the Action window. When the analyzer is capturing, it
Overview
continually samples the GPIB and records the occurrence of user-specified GPIB
events. You can configure the analyzer application to record captured information
for any combination of the following GPIB events:
The NI PCI-GPIB+, PCIe-GPIB+, and PCIe-GPIB+/LP devices include a complete
GPIB analyzer and GPIB controller on a single device. Compatible with HS488,
these devices are lower-cost alternatives to purchasing two separate products
for analyzer and controller functionality. You can use them to troubleshoot
IEEE 488 software and hardware problems or control GPIB instruments. You
can trigger on bus patterns or specific GPIB events and benchmark system
performance with the built-in timestamping capabilities.
◾◾
Data transfers
◾◾
Command transfers
◾◾
Control-line transition
◾◾
Handshake-line transition
◾◾
Parallel-poll response
In addition, you can configure the analyzer application to continually
reuse the capture buffer (treat it as a circular buffer) until you stop the
capture operation.
Monitoring the Bus
The GPIB analyzer software displays the current state of the GPIB at all times.
The Bus Monitor window shows the real-time state of each of the 16 GPIB
data and control lines. It displays the state of the eight data lines in ASCII,
hexadecimal, and binary formats and the state of the eight control lines in the
binary format.
You can configure the analyzer application to participate in the IEEE 488.1
three-wire handshake while capturing. For nonintrusive captures, you can
configure the analyzer application not to participate in the IEEE 488.1 three-
wire handshake while capturing. Besides capturing the standard IEEE 488.1
three-wire handshake, the analyzer application can capture high-speed HS488
data transfers. If desired, you can configure the analyzer application to record
timestamps with each captured event. Recorded timestamps have a
50 ns resolution.
The window displays the binary format as a series of LEDs, one for each GPIB
line represented.
Each GPIB data and control line has a corresponding toggle switch you can
use to assert one or more of these lines at any time. Using these switches, you
can exercise simple control over the GPIB, such as stepping through the states
of the source or acceptor handshake. The Accept Byte button performs a single
acceptor handshake sequence. The GPIB analyzer software offers several options
for capturing and analyzing activity on the GPIB. You enable the capture by using
Sometimes you may want to focus a capture operation on a specific GPIB
pattern that occurs at some unknown time. With the analyzer application, you
can define a GPIB trigger condition and select the number of events to record


 英伟达新AI芯片Rubin或提前半年亮相

 苹果iPhone 17将全系采用三星/LG显示LTPO OLED面板

 三星深化印度制造布局,供应链本地化进程加速

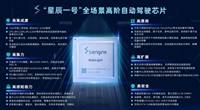
 芯擎科技“星辰一号”自动驾驶芯片点亮成功,2025年量产在即
