
 5秒后页面跳转

| 型号 | 品牌 | 描述 | 获取价格 | 数据表 |
| ACS110-7SB2 | STMICROELECTRONICS | AC LINE SWITCH |
获取价格 |

|
| ACS110-7SN | STMICROELECTRONICS | AC LINE SWITCH |
获取价格 |
|
| ACS112D | INTERSIL | Radiation Hardened Dual J-K Flip-Flop |
获取价格 |
|
| ACS112D/SAMPLE | RENESAS | AC SERIES, DUAL NEGATIVE EDGE TRIGGERED J-K FLIP-FLOP, COMPLEMENTARY OUTPUT, CDIP16, SIDE |
获取价格 |
|
| ACS112D/SAMPLE-02 | RENESAS | AC SERIES, DUAL NEGATIVE EDGE TRIGGERED J-K FLIP-FLOP, COMPLEMENTARY OUTPUT, CDIP16, SIDE |
获取价格 |
|
| ACS112HMSR | INTERSIL | Radiation Hardened Dual J-K Flip-Flop |
获取价格 |
|
 MAX6675资料手册参数详解、引脚配置说明

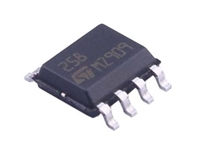 LM258引脚图及功能介绍、主要参数分析
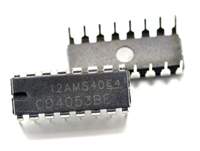 CD4052资料手册参数详解、引脚配置说明
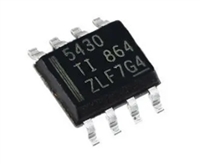 一文带你了解TPS5430资料手册分析:参数介绍、引脚配置说明
工作时间:9:00-21:00
CEO邮箱:ceo@jiepei.com
投诉邮箱:tousu@jiepei.com


 浙公网安备 33010502006866号 浙ICP备10014259号-119
营业执照ICP证
浙公网安备 33010502006866号 浙ICP备10014259号-119
营业执照ICP证


