
 5秒后页面跳转

| 型号 | 品牌 | 描述 | 获取价格 | 数据表 |
| 2N6490BU | ONSEMI | 15A, 60V, PNP, Si, POWER TRANSISTOR, TO-220AB, 3 PIN |
获取价格 |

|
| 2N6490C | MOTOROLA | 15A, 60V, PNP, Si, POWER TRANSISTOR, TO-220AB |
获取价格 |
|
| 2N6490-DR6260 | RENESAS | Power Bipolar Transistor, 15A I(C), 60V V(BR)CEO, 1-Element, PNP, Silicon, TO-220AB, Plast |
获取价格 |
|
| 2N6490-DR6274 | RENESAS | 15A, 60V, PNP, Si, POWER TRANSISTOR, TO-220AB |
获取价格 |
|
| 2N6490-DR6280 | RENESAS | Power Bipolar Transistor, 15A I(C), 60V V(BR)CEO, 1-Element, PNP, Silicon, TO-220AB, Plast |
获取价格 |
|
| 2N6490G | ONSEMI | Complementary Silicon Plastic Power Transisto |
获取价格 |
|
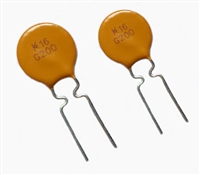 NTC热敏电阻与PTC热敏电阻的应用原理及应用范围

 GTO与普通晶闸管相比为什么可以自关断?为什么普通晶闸管不能呢?从GTO原理、应用范围带你了解原因及推荐型号
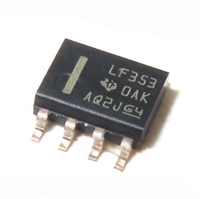 LF353数据手册解读:特性、应用、封装、引脚说明、电气参数及替换型号推荐
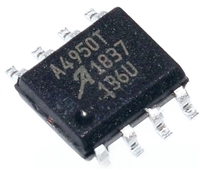 A4950资料手册解读:特性、应用、封装、引脚功能、电气参数及代换型号
工作时间:9:00-21:00
CEO邮箱:ceo@jiepei.com
投诉邮箱:tousu@jiepei.com


 浙公网安备 33010502006866号 浙ICP备10014259号-119
营业执照ICP证
浙公网安备 33010502006866号 浙ICP备10014259号-119
营业执照ICP证


