
 5秒后页面跳转

| 型号 | 品牌 | 获取价格 | 描述 | 数据表 |
| Y1441106R000T9L | VISHAY |
获取价格 |
RES 106 OHM 1W 0.01% RADIAL |

|
| Y1441109K000B9L | VISHAY |
获取价格 |
Fixed Resistor, Metal Foil, 1W, 109000ohm, 350V, 0.1% +/-Tol, -.2,.2ppm/Cel, 5816 |
|
| Y1441109K000D9L | VISHAY |
获取价格 |
Fixed Resistor, Metal Foil, 1W, 109000ohm, 350V, 0.5% +/-Tol, -.2,.2ppm/Cel, 5816 |
|
| Y1441109K000V9L | VISHAY |
获取价格 |
Fixed Resistor, Metal Foil, 1W, 109000ohm, 350V, 0.005% +/-Tol, -.2,.2ppm/Cel, 5816 |
|
| Y1441109R000B9L | VISHAY |
获取价格 |
Fixed Resistor, Metal Foil, 1W, 109ohm, 350V, 0.1% +/-Tol, -.2,.2ppm/Cel, 5816 |
|
| Y1441109R000D9L | VISHAY |
获取价格 |
Fixed Resistor, Metal Foil, 1W, 109ohm, 350V, 0.5% +/-Tol, -.2,.2ppm/Cel, 5816 |
|
| Y1441109R000Q9L | VISHAY |
获取价格 |
暂无描述 |
|
| Y1441109R000V9L | VISHAY |
获取价格 |
Fixed Resistor, Metal Foil, 1W, 109ohm, 350V, 0.005% +/-Tol, -.2,.2ppm/Cel, 5816 |
|
| Y144110K0000T9L | VISHAY |
获取价格 |
RES 10K OHM 1W 0.01% RADIAL |
|
| Y144110K0000V9L | VISHAY |
获取价格 |
Z204T 10K000 0.005% |
|
 压敏电阻器在直流电路中的过压保护应用探讨

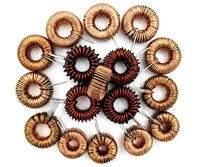 电感耐压值及其与电感大小的关系
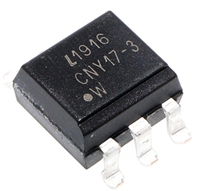 CNY17F光耦合器:特性、应用、封装、引脚功能及替换型号解析
 DS1307资料解析:特性、引脚说明、替代推荐
工作时间:9:00-21:00
CEO邮箱:ceo@jiepei.com
投诉邮箱:tousu@jiepei.com


 浙公网安备 33010502006866号 浙ICP备10014259号-119
营业执照ICP证
浙公网安备 33010502006866号 浙ICP备10014259号-119
营业执照ICP证


