
 5秒后页面跳转

| 生命周期: | Transferred | 包装说明: | CYLINDRICAL, O-PBCY-T3 |
| Reach Compliance Code: | unknown | ECCN代码: | EAR99 |
| HTS代码: | 8541.21.00.75 | 风险等级: | 5.61 |
| 其他特性: | LOW NOISE | 最大集电极电流 (IC): | 0.1 A |
| 基于收集器的最大容量: | 4.5 pF | 集电极-发射极最大电压: | 25 V |
| 配置: | SINGLE | 最小直流电流增益 (hFE): | 120 |
| JEDEC-95代码: | TO-92 | JESD-30 代码: | O-PBCY-T3 |
| 元件数量: | 1 | 端子数量: | 3 |
| 最高工作温度: | 150 °C | 封装主体材料: | PLASTIC/EPOXY |
| 封装形状: | ROUND | 封装形式: | CYLINDRICAL |
| 极性/信道类型: | NPN | 功耗环境最大值: | 1 W |
| 认证状态: | Not Qualified | 表面贴装: | NO |
| 端子形式: | THROUGH-HOLE | 端子位置: | BOTTOM |
| 晶体管应用: | AMPLIFIER | 晶体管元件材料: | SILICON |
| 标称过渡频率 (fT): | 280 MHz | VCEsat-Max: | 0.6 V |
| Base Number Matches: | 1 |
| 型号 | 品牌 | 获取价格 | 描述 | 数据表 |
| BC239RLRF | MOTOROLA |
获取价格 |
100mA, 25V, NPN, Si, SMALL SIGNAL TRANSISTOR, TO-92 |

|
| BC239RLRM | MOTOROLA |
获取价格 |
100mA, 25V, NPN, Si, SMALL SIGNAL TRANSISTOR, TO-92 |
|
| BC239RLRM | ONSEMI |
获取价格 |
100mA, 25V, NPN, Si, SMALL SIGNAL TRANSISTOR, TO-92, PLASTIC, TO-226AA, 3 PIN |
|
| BC239RLRP | MOTOROLA |
获取价格 |
100mA, 25V, NPN, Si, SMALL SIGNAL TRANSISTOR, TO-92 |
|
| BC239-TA | CJ |
获取价格 |
TO-92 Plastic-Encapsulate Transistors |
|
| BC239ZL1 | MOTOROLA |
获取价格 |
Small Signal Bipolar Transistor, 0.1A I(C), 25V V(BR)CEO, 1-Element, NPN, Silicon, TO-92 |
|
| BC239ZL1 | ONSEMI |
获取价格 |
100mA, 25V, NPN, Si, SMALL SIGNAL TRANSISTOR, TO-92, PLASTIC, TO-226AA, 3 PIN |
|
| BC23S03 | AMPHENOL |
获取价格 |
PCB Connector |
|
| BC-23S-03 | AMPHENOL |
获取价格 |
PCB CONNECTOR, ROHS COMPLIANT |
|
| BC-23S-03-1 | AMPHENOL |
获取价格 |
PCB Connector, ROHS COMPLIANT |
|
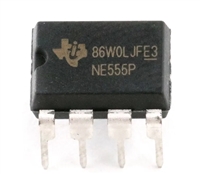 解读NE555P资料手册:电气参数、引脚功能及替换型号推荐

 AO3415资料解读:电气参数、替换型号推荐
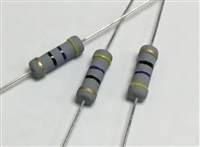 电阻上的数字意义及电阻值辨别方法
 金属氧化膜电阻器:定义、特点与深入解读
工作时间:9:00-21:00
CEO邮箱:ceo@jiepei.com
投诉邮箱:tousu@jiepei.com


 浙公网安备 33010502006866号 浙ICP备10014259号-119
营业执照ICP证
浙公网安备 33010502006866号 浙ICP备10014259号-119
营业执照ICP证


