
 5秒后页面跳转

| 型号 | 品牌 | 描述 | 获取价格 | 数据表 |
| ADL5330ACPZ-R2 | ADI | 10 MHz to 3 GHz VGA with 60 dB Gain Control Range |
获取价格 |

|
| ADL5330ACPZ-REEL7 | ADI | 10 MHz to 3 GHz VGA with 60 dB Gain Control Range |
获取价格 |
|
| ADL5330ACPZ-WP | ADI | 10 MHz to 3 GHz VGA with 60 dB Gain Control Range |
获取价格 |
|
| ADL5330-EVAL | ADI | 10 MHz to 3 GHz VGA with 60 dB Gain Control Range |
获取价格 |
|
| ADL5331 | ADI | 1 MHz to 1.2 GHz VGA with 30 dB Gain Control Range |
获取价格 |
|
| ADL5331ACPZ-R7 | ADI | 1 MHz to 1.2 GHz VGA with 30 dB Gain Control Range |
获取价格 |
|
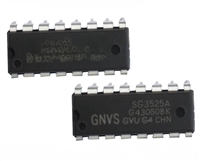 SG3525资料手册详解:SG3525参数分析、引脚说明、应用介绍

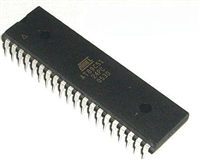 AT89C51单片机资料手册详细解析及应用示例
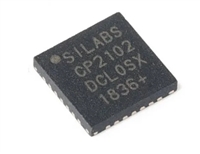 CP2102资料手册解读:CP2102引脚说明、关键参数分析
 资料手册解读:UC3842参数和管脚说明
工作时间:9:00-21:00
CEO邮箱:ceo@jiepei.com
投诉邮箱:tousu@jiepei.com


 浙公网安备 33010502006866号 浙ICP备10014259号-119
营业执照ICP证
浙公网安备 33010502006866号 浙ICP备10014259号-119
营业执照ICP证


