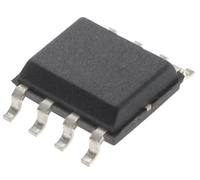
RHR1K160D
Thermal Resistance vs Mounting Pad Area
350
300
250
200
150
100
50
The maximum rated junction temperature, T , and the
R
= 110.2 - 25.24 x ln (AREA)
JM
θJA
thermal resistance of the heat dissipating path determines
the maximum allowable device power dissipation, P , in an
DM
o
2
239 C/W - 0.006in
application. Therefore the application’s ambient temperature,
o
o
o
2
T ( C), and thermal resistance R
( C/W) must be
201 C/W - 0.027in
A
θJA
reviewed to ensure that T is never exceeded. Equation 1
JM
mathematically represents the relationship and serves as
the basis for establishing the rating of the part.
(T
– T )
A
JM
Z
(EQ. 1)
P
= ----------------------------
DM
R
= 43.81 - 22.66 x ln (AREA)
θβ
θJA
0.001
0.01
0.1
In using surface mount devices such as the SOP-8 package,
the environment in which it is applied will have a significant
influence on the part’s current and maximum power
2
AREA, TOP COPPER AREA (in )
FIGURE 13. THERMAL RESISTANCE vs MOUNTING PAD AREA
dissipation ratings. Precise determination of P
and influenced by many factors:
is complex
DM
Displayed on the curve are R
θJA
values listed in the
Electrical Specifications table. These points were chosen to
depict the compromise between the copper board area, the
thermal resistance and ultimately the power dissipation,
1. Mounting pad area onto which the device is attached and
whether there is copper on one side or both sides of the
board.
P
. Thermal resistances corresponding to other
2. The number of copper layers and the thickness of the
board.
DM
component side copper areas can be obtained from Figure
13 or by calculation using Equation 2. The area, in square
inches is the top copper board area, the thermal resistance
3. The use of external heat sinks.
4. The use of thermal vias.
and ultimately the power dissipation, P
DM
.
5. Air flow and board orientation.
6. For non steady state applications, the pulse width, the
duty cycle and the transient thermal response of the part,
the board and the environment they are in.
R
= 110.18 – 25.24 × ln(Area)
(EQ. 2)
θJA
While Equation 2 describes the thermal resistance of a
single die, the dual die SOP-8 package introduces an
additional thermal component, thermal coupling resistance,
Intersil provides thermal information to assist the designer’s
preliminary application evaluation. Figure 13 defines the
R
. Equation 3 describes R as a function of the top
R
for the device as a function of the top copper
θβ θβ
θJA
copper mounting pad area.
(component side) area. This is for a horizontally positioned
FR-4 board with 2 oz. copper after 1000 seconds of steady
state power with no air flow. This graph provides the
necessary information for calculation of the steady state
junction temperature or power dissipation. Pulse
applications can be evaluated using the Intersil device
SPICE thermal model or manually utilizing the normalized
maximum transient thermal impedance curve.
R
= 43.81 – 22.66 × ln(Area)
(EQ. 3)
θβ
The thermal coupling resistance vs. copper area is also
graphically depicted in Figure 13. It is important to note the
thermal resistance (R
(Rθβ) are equivalent for both die. For example at 0.1 square
inches of copper:
) and thermal coupling resistance
θJA
o
R
R
= R
= 168 C/W
o
θJA1
θJA2
= Rθβ2 = 96 C/W
θβ1
T
and T define the junction temperature of the
J2
J1
respective die. Similarly, P and P define the power
1
2
dissipated in each die. The steady state junction
temperature can be calculated using Equation 4 for die 1
and Equation 5 for die 2.
Example: Use Equation 4 to calculate T and Equation 5 to
J1
calculate T with the following conditions. Die 2 is
J2
dissipating 0.5W; die 1 is dissipating 0W; the ambient
o
temperature is 60 C; the package is mounted to a top
copper area of 0.1 square inches per die.
5