
 5秒后页面跳转

| 型号 | 品牌 | 描述 | 获取价格 | 数据表 |
| K2000SRP | LITTELFUSE | SIDAC, 215V V(BO) Max, DO-214, ROHS COMPLIANT, PLASTIC PACKAGE-2 |
获取价格 |

|
| K2000SRP | TECCOR | SIDAC, 215V V(BO) Max, DO-214AA |
获取价格 |
|
| K2000Y | LITTELFUSE | SIDACs feature glass-passivated junctions to ensure a rugged and dependable |
获取价格 |
|
| K2000YH | LITTELFUSE | It is offered in a DO-15 and TO-92 leaded packages |
获取价格 |
|
| K200131 | E-SWITCH | Contact Resistance : 10m-OHMS |
获取价格 |
|
| K200132 | E-SWITCH | Contact Resistance : 10m-OHMS |
获取价格 |
|
 PCF8574资料解读:主要参数分析、引脚说明

 AD637数据手册解读:主要特性、引脚及其功能解读、电气参数
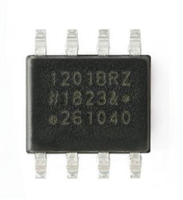 ADUM1201资料手册解读:参数分析、引脚说明、应用分析
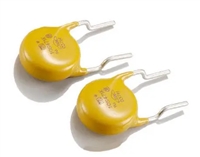 一文带你了解压敏电阻器在直流电路中的过压保护作用
工作时间:9:00-21:00
CEO邮箱:ceo@jiepei.com
投诉邮箱:tousu@jiepei.com


 浙公网安备 33010502006866号 浙ICP备10014259号-119
营业执照ICP证
浙公网安备 33010502006866号 浙ICP备10014259号-119
营业执照ICP证


