STM32F103x8, STM32F103xB
List of figures
List of figures
Figure 1.
Figure 2.
Figure 3.
Figure 4.
Figure 5.
Figure 6.
Figure 7.
Figure 8.
Figure 9.
STM32F103xx performance line block diagram . . . . . . . . . . . . . . . . . . . . . . . . . . . . . . . . . 19
Clock tree . . . . . . . . . . . . . . . . . . . . . . . . . . . . . . . . . . . . . . . . . . . . . . . . . . . . . . . . . . . . . . 20
STM32F103xx performance line LFBGA100 ballout . . . . . . . . . . . . . . . . . . . . . . . . . . . . . 21
STM32F103xx performance line LQFP100 pinout . . . . . . . . . . . . . . . . . . . . . . . . . . . . . . . 22
STM32F103xx performance line LQFP64 pinout . . . . . . . . . . . . . . . . . . . . . . . . . . . . . . . . 23
STM32F103xx performance line TFBGA64 ballout . . . . . . . . . . . . . . . . . . . . . . . . . . . . . . 24
STM32F103xx performance line LQFP48 pinout . . . . . . . . . . . . . . . . . . . . . . . . . . . . . . . . 25
STM32F103xx Performance Line VFQFPN36 pinout. . . . . . . . . . . . . . . . . . . . . . . . . . . . . 25
Memory map. . . . . . . . . . . . . . . . . . . . . . . . . . . . . . . . . . . . . . . . . . . . . . . . . . . . . . . . . . . . 31
Figure 10. Pin loading conditions. . . . . . . . . . . . . . . . . . . . . . . . . . . . . . . . . . . . . . . . . . . . . . . . . . . . . 33
Figure 11. Pin input voltage . . . . . . . . . . . . . . . . . . . . . . . . . . . . . . . . . . . . . . . . . . . . . . . . . . . . . . . . . 33
Figure 12. Power supply scheme. . . . . . . . . . . . . . . . . . . . . . . . . . . . . . . . . . . . . . . . . . . . . . . . . . . . . 33
Figure 13. Current consumption measurement scheme . . . . . . . . . . . . . . . . . . . . . . . . . . . . . . . . . . . 34
Figure 14. Typical current consumption in Run mode versus frequency (at 3.6 V) -
code with data processing running from RAM, peripherals enabled. . . . . . . . . . . . . . . . . . 40
Figure 15. Typical current consumption in Run mode versus frequency (at 3.6 V) -
code with data processing running from RAM, peripherals disabled . . . . . . . . . . . . . . . . . 40
Figure 16. Typical current consumption on V
with RTC on versus temperature at different
BAT
V
values . . . . . . . . . . . . . . . . . . . . . . . . . . . . . . . . . . . . . . . . . . . . . . . . . . . . . . . . . . . . 42
BAT
Figure 17. Typical current consumption in Stop mode with regulator in Run mode versus
temperature at V = 3.3 V and 3.6 V . . . . . . . . . . . . . . . . . . . . . . . . . . . . . . . . . . . . . . . . 43
DD
Figure 18. Typical current consumption in Stop mode with regulator in Low-power mode versus
temperature at V = 3.3 V and 3.6 V . . . . . . . . . . . . . . . . . . . . . . . . . . . . . . . . . . . . . . . . 43
DD
Figure 19. Typical current consumption in Standby mode versus temperature at
V
= 3.3 V and 3.6 V . . . . . . . . . . . . . . . . . . . . . . . . . . . . . . . . . . . . . . . . . . . . . . . . . . . . 44
DD
Figure 20. High-speed external clock source AC timing diagram . . . . . . . . . . . . . . . . . . . . . . . . . . . . 49
Figure 21. Low-speed external clock source AC timing diagram. . . . . . . . . . . . . . . . . . . . . . . . . . . . . 49
Figure 22. Typical application with an 8 MHz crystal . . . . . . . . . . . . . . . . . . . . . . . . . . . . . . . . . . . . . . 50
Figure 23. Typical application with a 32.768 kHz crystal . . . . . . . . . . . . . . . . . . . . . . . . . . . . . . . . . . . 51
Figure 24. I/O AC characteristics definition . . . . . . . . . . . . . . . . . . . . . . . . . . . . . . . . . . . . . . . . . . . . . 60
Figure 25. Recommended NRST pin protection . . . . . . . . . . . . . . . . . . . . . . . . . . . . . . . . . . . . . . . . . 61
2
Figure 26. I C bus AC waveforms and measurement circuit . . . . . . . . . . . . . . . . . . . . . . . . . . . . . . . . 63
Figure 27. SPI timing diagram - slave mode and CPHA = 0 . . . . . . . . . . . . . . . . . . . . . . . . . . . . . . . . 65
(1)
Figure 28. SPI timing diagram - slave mode and CPHA = 1 . . . . . . . . . . . . . . . . . . . . . . . . . . . . . . 65
(1)
Figure 29. SPI timing diagram - master mode . . . . . . . . . . . . . . . . . . . . . . . . . . . . . . . . . . . . . . . . . 66
Figure 30. USB timings: definition of data signal rise and fall time . . . . . . . . . . . . . . . . . . . . . . . . . . . 67
Figure 31. ADC accuracy characteristics. . . . . . . . . . . . . . . . . . . . . . . . . . . . . . . . . . . . . . . . . . . . . . . 70
Figure 32. Typical connection diagram using the ADC . . . . . . . . . . . . . . . . . . . . . . . . . . . . . . . . . . . . 71
Figure 33. Power supply and reference decoupling (V
Figure 34. Power supply and reference decoupling (V
Figure 35. VFQFPN36 6 x 6 mm, 0.5 mm pitch, package outline
not connected to V
). . . . . . . . . . . . . . 71
). . . . . . . . . . . . . . . . . 72
REF+
DDA
connected to V
REF+
DDA
(1). . . . . . . . . . . . . . . . . . . . . . . . . . . . . . . . . .74
(1)(2)(3). . . . . . . . . . . . . . . . . . . . . . . . . . . . . . . . . . . . . .74
Figure 36. Recommended footprint (dimensions in mm)
Figure 37. LFBGA100 - 10 x 10 mm low profile fine pitch ball grid array package
outline . . . . . . . . . . . . . . . . . . . . . . . . . . . . . . . . . . . . . . . . . . . . . . . . . . . . . . . . . . . . . . . . . 75
Figure 38. Recommended PCB design rules (0.80/0.75 mm pitch BGA) . . . . . . . . . . . . . . . . . . . . . . 76
Figure 39. LQFP100, 14 x 14 mm 100-pin low-profile quad flat package outline . . . . . . . . . . . . . . . . 77
(1)
Figure 40. Recommended footprint . . . . . . . . . . . . . . . . . . . . . . . . . . . . . . . . . . . . . . . . . . . . . . . . . 77
Figure 41. LQFP64, 10 x 10 mm, 64-pin low-profile quad flat package outline . . . . . . . . . . . . . . . . . . 78
Doc ID 13587 Rev 11
7/92

 5秒后页面跳转


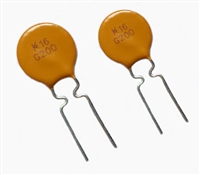 NTC热敏电阻与PTC热敏电阻的应用原理及应用范围

 GTO与普通晶闸管相比为什么可以自关断?为什么普通晶闸管不能呢?从GTO原理、应用范围带你了解原因及推荐型号
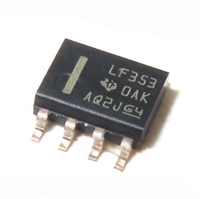 LF353数据手册解读:特性、应用、封装、引脚说明、电气参数及替换型号推荐
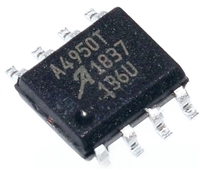 A4950资料手册解读:特性、应用、封装、引脚功能、电气参数及代换型号


 浙公网安备 33010502006866号 浙ICP备10014259号-119
营业执照ICP证
浙公网安备 33010502006866号 浙ICP备10014259号-119
营业执照ICP证


