NTC Thermistors
General Characteristics
Thus, the tolerance on the resistance (⌬R2/R2) at a temper-
ature T2 is the sum of two contributions as illustrated on
Figure 1:
2.1.5. Further approximation of R (T) curve
The description of the characteristic R (T) can be improved
by using a greater number of experimental points, and by
using the equation:
– the tolerance ⌬R1/R1 at a temperature T1 used as a
reference.
1
T
3
= A + B (ᐍn R) + C (ᐍn R)
– an additional contribution due to the dispersion on
the characteristic R (T) which may be called
“Manufacturing tolerance” (Tf).
The parameters A, B and C are determined by solving the
set of equations obtained by using the measured resis-
tances at three temperatures.
Graph with B
The solution of the above equation gives the resistance at
any temperature:
RΩ
Graph with B ΔB
2
3
3
1
3
B
C
A-1/T
A-1/T
+ 4
27
2
3
ͱ ͱ
ᐍn R (T) =
ͱ
3
27
-
+
( ) ( ( ) ( ) )
C
[
(ΔR)25°C
C
2
}
R
25
3
A-1/T 2
A-1/T
( )
C
3
2
3
27
2
B
ͱ
ͱ
27
ͱ
-
+
+
3
+ 4
(
)
]
(C)
( )
C
(ΔR)25°C
}
= (ΔR)T
+
}
The precision of this description is typically 0.2°C for the
range –50 to +150°C (A, B, C being determined with exper-
imental values at –20, +50 and 120°C) or even better if this
temperature range is reduced. The ratios R(T)/R(25°C) for
each of the different materials shown on pages 29 to 33
have been calculated using the above method.
}
T
F
25°C
Temperature (°C)
T
2.1.6. Resistance tolerance and temperature
precision
An important characteristic of a thermistor is the tolerance
on the resistance value at a given temperature.
Figure 1
Differentiating the equation R = A exp (B/T), the two contri-
butions on the tolerance at T can also be written:
This uncertainty on the resistance (DR/R) may be related to
the corresponding uncertainty on the temperature (DT),
using the relationship:
⌬R2
1
+ ⎪1T - T ⎪ • ⌬B
⌬R1
R1
=
1
2
R2
⌬R
1
⌬T = 100 •
•
␣
The T(f) values given with the resistance – temperature
characteristics on pages 29 to 33 are based on a computer
simulation using this equation and experimental values.
R
Example: consider the thermistor ND06M00152J —
• R (25°C) = 1500 ohms
2.1.8. Designing the resistance tolerances
• Made from M material
Using the fact that the coefficient ␣ decreases with temper-
2
ature (α = –B/T ), it is generally useful to define the closest
• R (T) characteristic shown on page 23 gives:
␣ = - 4.4%/°C at 25°C
tolerance of the thermistor at the maximum value of the
temperature range where an accuracy in °C is required.
• Tolerance ⌬R/R = 5% is equivalent to:
⌬T = 5%/4.4%/°C = 1.14°C
For example, let us compare the two designs 1 and 2
hereafter:
2.1.7. Resistance tolerance at any temperature
Any material used for NTC manufacturing always displays a
dispersion for the R (T) characteristic.
T
(°C)
R
α
Design 1
Design 2
⌬R/R(%) ⌬T(°C)
(Ω) (%/°C) ⌬R/R(%) ⌬T(°C)
0
25
3275
1000
300
-5.2
-4.4
-3.7
-3.1
3.5
3.0
3.5
4.1
4.5
0.7
0.7
1.0
1.3
1.6
5.0
4.5
4.0
3.4
3.0
1.0
1.1
1.1
1.1
1.0
This dispersion depends on the type of material used
and has been especially reduced for our accuracy series
thermistors.
55
85
109
100
69.4 -2.9
Only the Design 2 is able to meet the requirement ΔT Ӎ 1°C
from 25°C to 100°C.
3

 5秒后页面跳转


 STM32F030C6芯片介绍:主要参数分析、引脚配置说明、功耗及封装

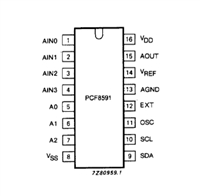 PCF8591数据手册解读:参数、引脚说明
 一文带你了解ss8050参数、引脚配置、应用指南
 深入解析AD7606高性能多通道模数转换器:资料手册参数分析


 浙公网安备 33010502006866号 浙ICP备10014259号-119
营业执照ICP证
浙公网安备 33010502006866号 浙ICP备10014259号-119
营业执照ICP证


