
 5秒后页面跳转

| 品牌 | Logo | 应用领域 |
| 力特 - LITTELFUSE | 双向触发二极管 | |
| 页数 | 文件大小 | 规格书 |
| 8页 | 671K |  |
| 描述 | ||
| Standard Unidirectional SIDACs | ||

| 是否Rohs认证: | 符合 | 生命周期: | Active |
| Reach Compliance Code: | unknown | 风险等级: | 1.79 |
| JESD-609代码: | e3 | 峰值回流温度(摄氏度): | 260 |
| 端子面层: | Matte Tin (Sn) | 处于峰值回流温度下的最长时间: | 40 |
| 触发设备类型: | SIDAC |
| 型号 | 品牌 | 描述 | 获取价格 | 数据表 |
| K1500S | TECCOR | silicon bilateral voltage triggered switch |
获取价格 |
|
| K1500S | LITTELFUSE | SIDAC是一种硅控双向电压触发的开关。 当电压超过SIDAC转折电压点时,SIDAC开关 |
获取价格 |
|
| K1500S1URP | LITTELFUSE | Standard Unidirectional SIDACs |
获取价格 |
|
| K1500S70RP | LITTELFUSE | SIDAC, 170V V(BO) Max, DO-214, ROHS COMPLIANT, PLASTIC PACKAGE-2 |
获取价格 |
|
| K1500SA | JJM | 触发管 |
获取价格 |
|
| K1500SB | JJM | 触发管 |
获取价格 |
|
 STM32F030C6芯片介绍:主要参数分析、引脚配置说明、功耗及封装

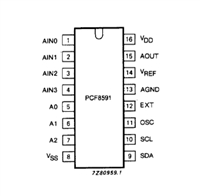 PCF8591数据手册解读:参数、引脚说明
 一文带你了解ss8050参数、引脚配置、应用指南
 深入解析AD7606高性能多通道模数转换器:资料手册参数分析
工作时间:9:00-21:00
CEO邮箱:ceo@jiepei.com
投诉邮箱:tousu@jiepei.com


 浙公网安备 33010502006866号 浙ICP备10014259号-119
营业执照ICP证
浙公网安备 33010502006866号 浙ICP备10014259号-119
营业执照ICP证


