
 5秒后页面跳转

| 品牌 | Logo | 应用领域 |
| 力特 - LITTELFUSE | 双向触发二极管高压 | |
| 页数 | 文件大小 | 规格书 |
| 7页 | 181K |  |
| 描述 | ||
| High-voltage lamp ignitors | ||

| 型号 | 品牌 | 描述 | 获取价格 | 数据表 |
| K1100G70AP | LITTELFUSE | SIDAC, 330V V(BO) Max, DO-15, ROHS COMPLIANT, PLASTIC PACKAGE-2 |
获取价格 |
|
| K1100G70RP | LITTELFUSE | SIDAC, 330V V(BO) Max, DO-15, ROHS COMPLIANT, PLASTIC PACKAGE-2 |
获取价格 |
|
| K1100GRP | TECCOR | 暂无描述 |
获取价格 |
|
| K1100GURP | LITTELFUSE | SIDAC, |
获取价格 |
|
| K1100S | LITTELFUSE | High-voltage lamp ignitors |
获取价格 |
|
| K1100S | TECCOR | silicon bilateral voltage triggered switch |
获取价格 |
|
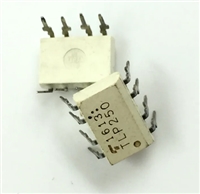 TLP250光耦合器:资料手册参数分析

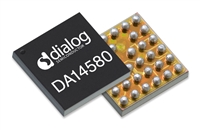 DA14580 低功耗蓝牙系统级芯片(SoC):资料手册参数分析
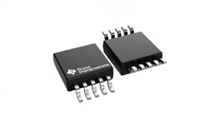 INA226 高精度电流和功率监控器:资料手册参数分析
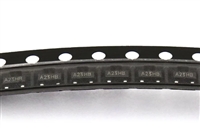 SI2302 N沟道MOSFET:资料手册参数分析
工作时间:9:00-21:00
CEO邮箱:ceo@jiepei.com
投诉邮箱:tousu@jiepei.com


 浙公网安备 33010502006866号 浙ICP备10014259号-119
营业执照ICP证
浙公网安备 33010502006866号 浙ICP备10014259号-119
营业执照ICP证


