HFBR-2602Z Receiver
Absolute Maximum Ratings
Parameter
Symbol
TS
Min.
-55
-40
Max.
85
Units
°C
Reference
Storage Temperature
Operating Temperature
Lead Soldering Cycle
TA
85
°C
Temp.
Time
260
10
°C
Note 1
Note 1
s
Supply Voltage
Vcc
IO
-0.5
-0.5
7.0
25
V
Output Current
mA
V
Output Voltage
VO
18.0
40
Output Collector Power Dissipation
Fan Out (TTL)
PO AVG
N
mW
5
Note 8
Electrical/Optical Characteristics 0 to 55° C;
Fiber core diameter ≤ 1.0 mm, fiber N.A. ≤ 0.5, 4.75 V ≤ V ≤ 5.25 V
CC
[2]
Parameter
Symbol
Min.
Typ.
Max.
Unit
Condition
Reference
High Level Output Current
IOH
5
250
A
VOH = 18 V
PR < -31.2 dBm
Low Level Output Voltage
High Level Supply Current
Low Level Supply Current
VOL
ICCH
ICCL
0.4
3.5
6.2
0.5
6.3
10
V
IOL = 8 mA
PR > -20.0 dBm
mA
mA
VCC = 5.25 V
PR < -31.2 dBm
VCC = 5.25 V
PR > -20.0 dBm
-9
Dynamic Characteristics 0 to 55° C unless otherwise specified; 4.75 V ≤ V ≤ 5.25 V; BER ≤ 10
CC
[2]
Parameter
Symbol
Min.
Typ.
Max.
Unit
Condition
Reference
Peak Input Power
Level Logic HIGH
PRH
-31.2
dBm
P = 655 nm
Note 7
Peak Input Power
Level Logic LOW
PRL
-20.0
-5.0
dBm
ns
IOL = 8 mA
Note 7
Propagation Delay
LOW to HIGH
tPLH
tPHL
PWD
60
PR = -20 dBm
2 MBd
Note 8, 9
Note 8, 9
Propagation Delay
HIGH to LOW
110
ns
PR = -20 dBm
2 MBd
Pulse Width Distortion,
tPLH - tPHL
50
-50
ns
ns
PR = -5 dBm
PR = -20 dBm
Note 10
Figure 6
Notes:
1. 2.0 mm from where leads enter case.
2. Typical data at T = +25° C.
A
3. Thermal resistance is measured with the transmitter coupled to a connector assembly and fiber, and mounted on a printed circuit board.
4. Pins 2, 6, and 7 are welded to the cathode header connection to minimize the thermal resistance from junction to ambient. To further reduce the
thermal resistance, the cathode trace should be made as large as is consistent with good RF circuit design.
5.
P is measured with a large area detector at the end of 0.5 metre of plastic optical fiber with 1 mm diameter and numerical aperture of 0.5.
T
6. When changing W to dBm, the optical power is referenced to 1 mW (1000 W). Optical Power P(dBm) = 10 log [P (W)/1000 W].
7. Measured at the end of 1mm plastic fiber optic cable with a large area detector.
8. 8 mA load (5 x 1.6 mA), R = 560 .
L
9. Propagation delay through the system is the result of several sequentially occurring phenomena. Consequently it is a combination of data-rate-
limiting effects and of transmission-time effects. Because of this, the data-rate limit of the system must be described in terms of time differentials
between delays imposed on falling and rising edges. As the cable length is increased, the propagation delays increase. Data-rate, as limited by
pulse width distortion, is not affected by increasing cable length if the optical power level at the receiver is maintained.
10. Pulse width distortion is the difference between the delay of the rising and falling edges.
11. Both HFBR-1602Z and HFBR-1604Z meet the SERCOS "low attenuation" specifications when operated at 35 mA; only HFBR-1604Z meets the
SERCOS "high attenuation" limits when operated at 60 mA.
4

 5秒后页面跳转


 STM32F030C6芯片介绍:主要参数分析、引脚配置说明、功耗及封装

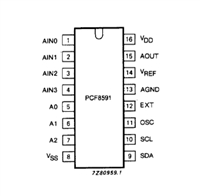 PCF8591数据手册解读:参数、引脚说明
 一文带你了解ss8050参数、引脚配置、应用指南
 深入解析AD7606高性能多通道模数转换器:资料手册参数分析


 浙公网安备 33010502006866号 浙ICP备10014259号-119
营业执照ICP证
浙公网安备 33010502006866号 浙ICP备10014259号-119
营业执照ICP证


