
 5秒后页面跳转

| 型号 | 品牌 | 描述 | 获取价格 | 数据表 |
| 8408901EX | TI | HC/UH SERIES, POSITIVE EDGE TRIGGERED D FLIP-FLOP, COMPLEMENTARY OUTPUT, CDIP16, CERAMIC, |
获取价格 |

|
| 8408901FA | TI | QUADRUPLE D-TYPE FLIP-FLOPS WITH CLEAR |
获取价格 |
|
| 8408901FX | ETC | Quad D-Type Flip-Flop |
获取价格 |
|
| 8408RPFB | MAXWELL | Quad 8-Bit Multiplying CMOS D/A Converter with Memory |
获取价格 |
|
| 8408RPFE | MAXWELL | Quad 8-Bit Multiplying CMOS D/A Converter with Memory |
获取价格 |
|
| 8408RPFI | MAXWELL | Quad 8-Bit Multiplying CMOS D/A Converter with Memory |
获取价格 |
|
 STM32F030C6芯片介绍:主要参数分析、引脚配置说明、功耗及封装

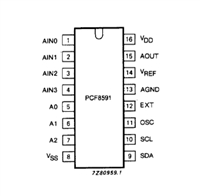 PCF8591数据手册解读:参数、引脚说明
 一文带你了解ss8050参数、引脚配置、应用指南
 深入解析AD7606高性能多通道模数转换器:资料手册参数分析
工作时间:9:00-21:00
CEO邮箱:ceo@jiepei.com
投诉邮箱:tousu@jiepei.com


 浙公网安备 33010502006866号 浙ICP备10014259号-119
营业执照ICP证
浙公网安备 33010502006866号 浙ICP备10014259号-119
营业执照ICP证


