
 5秒后页面跳转

| 型号 | 品牌 | 描述 | 获取价格 | 数据表 |
| 2N6044AU | ONSEMI | TRANSISTOR 8 A, 80 V, NPN, Si, POWER TRANSISTOR, PLASTIC, TO-220AB, 3 PIN, BIP General Pur |
获取价格 |

|
| 2N6044BA | ONSEMI | 8A, 80V, NPN, Si, POWER TRANSISTOR, PLASTIC, TO-220AB, 3 PIN |
获取价格 |
|
| 2N6044BC | ONSEMI | TRANSISTOR 8 A, 80 V, NPN, Si, POWER TRANSISTOR, PLASTIC, TO-220AB, 3 PIN, BIP General Pur |
获取价格 |
|
| 2N6044BD | ONSEMI | 8A, 80V, NPN, Si, POWER TRANSISTOR, PLASTIC, TO-220AB, 3 PIN |
获取价格 |
|
| 2N6044BU | ONSEMI | TRANSISTOR 8 A, 80 V, NPN, Si, POWER TRANSISTOR, PLASTIC, TO-220AB, 3 PIN, BIP General Pur |
获取价格 |
|
| 2N6044BV | ONSEMI | 8A, 80V, NPN, Si, POWER TRANSISTOR, PLASTIC, TO-220AB, 3 PIN |
获取价格 |
|
 STM32F030C6芯片介绍:主要参数分析、引脚配置说明、功耗及封装

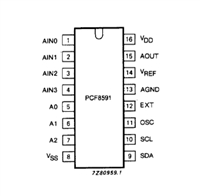 PCF8591数据手册解读:参数、引脚说明
 一文带你了解ss8050参数、引脚配置、应用指南
 深入解析AD7606高性能多通道模数转换器:资料手册参数分析
工作时间:9:00-21:00
CEO邮箱:ceo@jiepei.com
投诉邮箱:tousu@jiepei.com


 浙公网安备 33010502006866号 浙ICP备10014259号-119
营业执照ICP证
浙公网安备 33010502006866号 浙ICP备10014259号-119
营业执照ICP证


