
 5秒后页面跳转

| 型号 | 品牌 | 描述 | 获取价格 | 数据表 |
| 1.5SMBJ8.2A | HUAXINAN | 1500W Transient Voltage Suppressors |
获取价格 |

|
| 1.5SMBJ8.2CA | HUAXINAN | 1500W Transient Voltage Suppressors |
获取价格 |
|
| 1.5SMBJ8.5A | YAGEO | 瞬态抑制二极管 (一般) |
获取价格 |
|
| 1.5SMBJ8.5A-AT | YAGEO | 瞬态抑制二极管 (车用) |
获取价格 |
|
| 1.5SMBJ8.5CA | YAGEO | 瞬态抑制二极管 (一般) |
获取价格 |
|
| 1.5SMBJ8.5CA-AT | YAGEO | 瞬态抑制二极管 (车用) |
获取价格 |
|
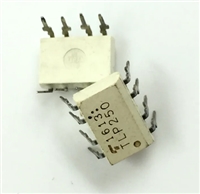 TLP250光耦合器:资料手册参数分析

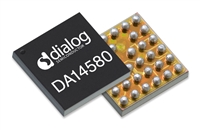 DA14580 低功耗蓝牙系统级芯片(SoC):资料手册参数分析
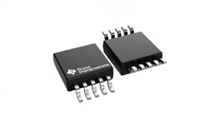 INA226 高精度电流和功率监控器:资料手册参数分析
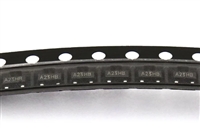 SI2302 N沟道MOSFET:资料手册参数分析
工作时间:9:00-21:00
CEO邮箱:ceo@jiepei.com
投诉邮箱:tousu@jiepei.com


 浙公网安备 33010502006866号 浙ICP备10014259号-119
营业执照ICP证
浙公网安备 33010502006866号 浙ICP备10014259号-119
营业执照ICP证


